Sea Level Trend
by mash
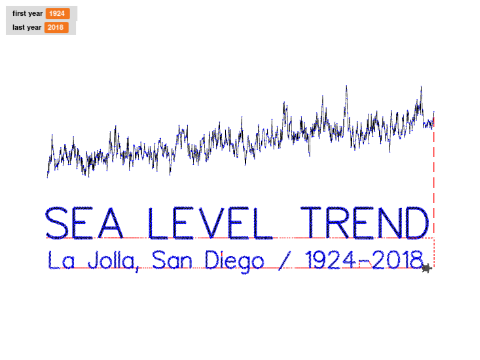
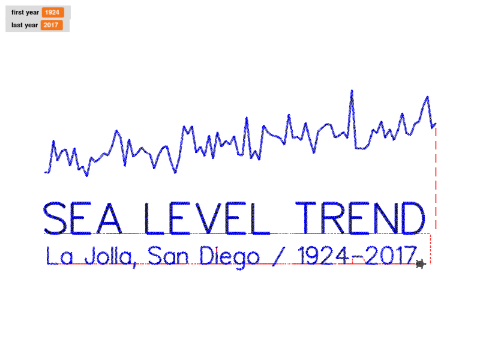
Relative Sea Level Trend
in La Jolla, California
1924 - 2018
The plot shows the monthly mean sea level without the regular seasonal fluctuations due to coastal ocean temperatures, salinities, winds, atmospheric pressures, and ocean currents. The plotted values are relative to the most recent Mean Sea Level datum established by CO-OPS.
Source: https://tidesandcurrents.noaa.gov/sltrends/sltrends_station.shtml?id=9410230
#data-visualization #global-warming #sea-level #climate-change #san-diego
Created: 7 years, 2 months ago



Comments (0)
No comments yet